Wondering why Bitcoin’s price can climb while the underlying buying pressure fades? This article explains the on‑chain indicators that track real demand, how they are calculated, and what they mean for anyone trying to earn crypto online.
What on‑chain metrics are and how they work
On‑chain metrics are data points derived directly from the blockchain – the public ledger that records every transaction. Because the blockchain is transparent, analysts can count coins that move, coins that stay idle, and new coins that are created. The most common terms you’ll encounter are:
- Spot demand: the net amount of Bitcoin that changes hands in the spot market (the market for immediate delivery). A rise means more people are buying and holding Bitcoin outright.
- Apparent demand: a measure that compares newly mined Bitcoin (the supply side) with the amount of Bitcoin that has been dormant for a year or more (the “long‑term holder” supply). When apparent demand contracts, fewer new buyers are absorbing fresh supply.
- Futures demand: the amount of Bitcoin locked into futures contracts, which are bets on future price movements. Growth in speculative futures demand shows confidence that the price will keep rising.
- Moving average: a statistical line that smooths price data over a set period, such as 365 days. When Bitcoin’s price crosses above its 365‑day moving average, many analysts treat it as a bullish signal.
Companies like CryptoQuant combine these data points into a single score – the “Bull Score” – that ranges from 0 (very bearish) to 100 (extremely bullish). The score rolls in on‑chain activity, market volume, and price trends to give a quick snapshot of overall market health.
Real‑world illustration
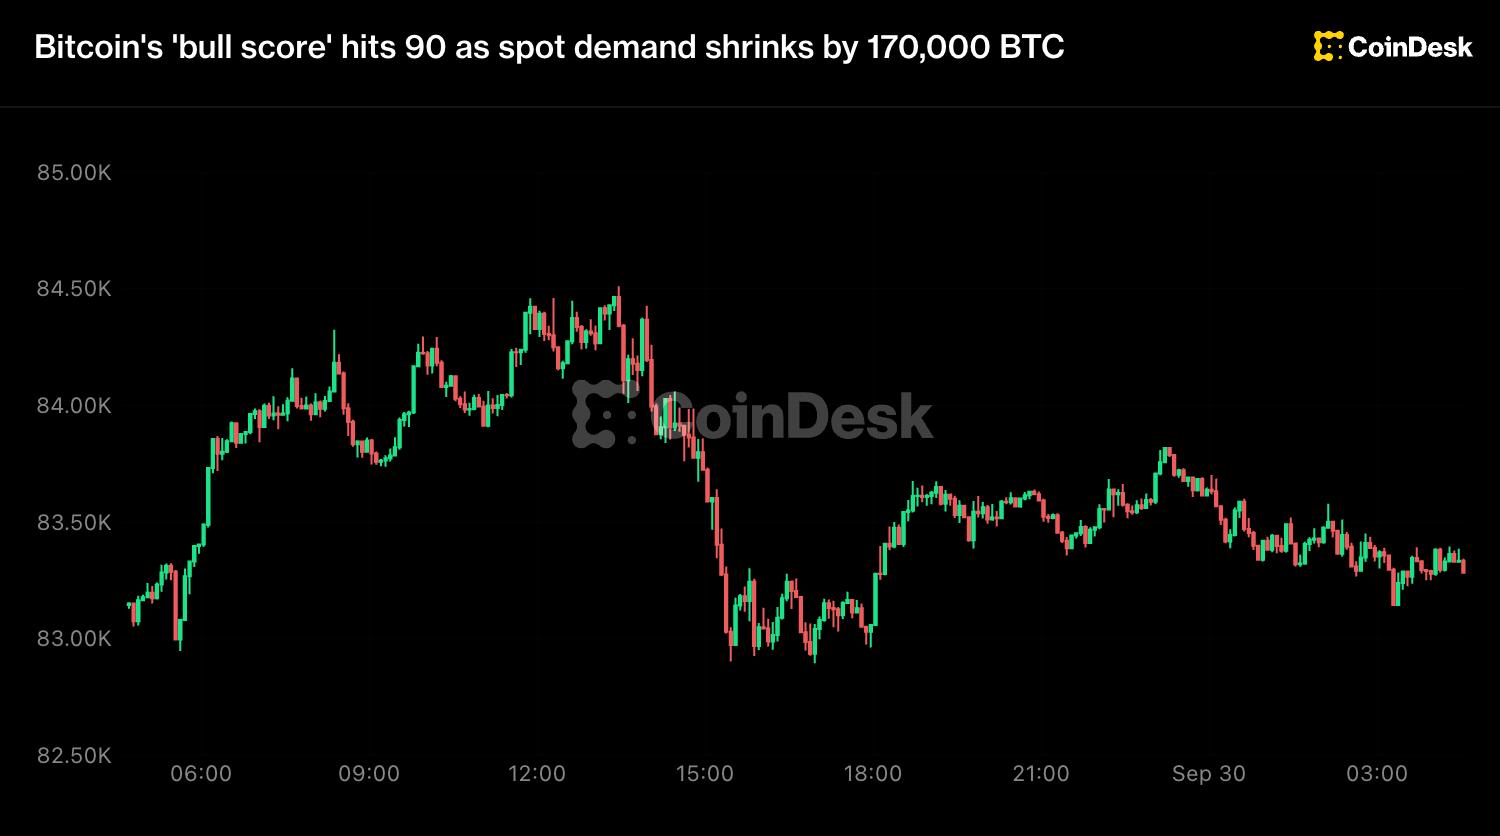
In September 2026, CryptoQuant’s Bull Score hit 90 out of 100 after Bitcoin broke above its 365‑day moving average, suggesting a strong bull market. However, the same period saw spot demand shrink by roughly 170,000 BTC over the previous 30 days, and speculative futures demand tumble 90 % in just 15 days. The apparent demand gauge, which tracks how many newly mined coins are being absorbed, contracted throughout the month, indicating that the rally was losing genuine buying power.
What this means for you as an online earner
If you earn crypto through mining, staking, or cloud‑based reward platforms, on‑chain metrics help you gauge whether price gains are likely to be sustained. A high Bull Score paired with shrinking spot and futures demand suggests that price increases may be driven by short‑term speculation rather than long‑term accumulation. In such environments, earnings from mining or staking can still be stable, but the market price of the rewards you receive may become volatile.
Conversely, when spot demand and apparent demand are both rising, it indicates that new buyers are entering the market and absorbing fresh supply. That scenario typically supports more durable price appreciation, which can enhance the fiat value of your crypto earnings.
What to check before committing to a crypto‑earning strategy
- Look at the latest spot demand figures. A consistent net inflow of Bitcoin into wallets suggests healthy buying pressure.
- Monitor the apparent demand gauge. If it’s expanding, miners and reward platforms are likely to see a supportive price environment.
- Check futures demand trends. Rapid growth can signal confidence, but a sudden drop may warn of an upcoming pull‑back.
- Consider the price’s relationship to its long‑term moving average. Staying above the 365‑day average is a common bullish indicator, but it should be confirmed by on‑chain demand.
- Use multiple sources. On‑chain data is powerful, but combine it with macro factors like regulatory news or energy costs for a fuller picture.
FAQ
What is the difference between spot demand and futures demand? Spot demand reflects actual buying and holding of Bitcoin right now, while futures demand reflects contracts betting on future price moves. Spot demand shows real ownership, futures demand shows market sentiment.
Can a high Bull Score guarantee price gains? No. The Bull Score aggregates several indicators, but it cannot predict sudden market shocks, regulatory changes, or macro‑economic events that can reverse trends.
How often do on‑chain metrics update? Most on‑chain data is refreshed daily because it relies on the latest blocks added to the blockchain. Some platforms provide intraday updates for high‑frequency traders.
Should I stop mining if spot demand is falling? Not necessarily. Mining rewards are paid in Bitcoin regardless of demand, but a prolonged drop in demand can depress Bitcoin’s price, reducing the fiat value of your earnings. Weigh the price outlook against your electricity and hardware costs.
This article references reporting from coindesk.com.