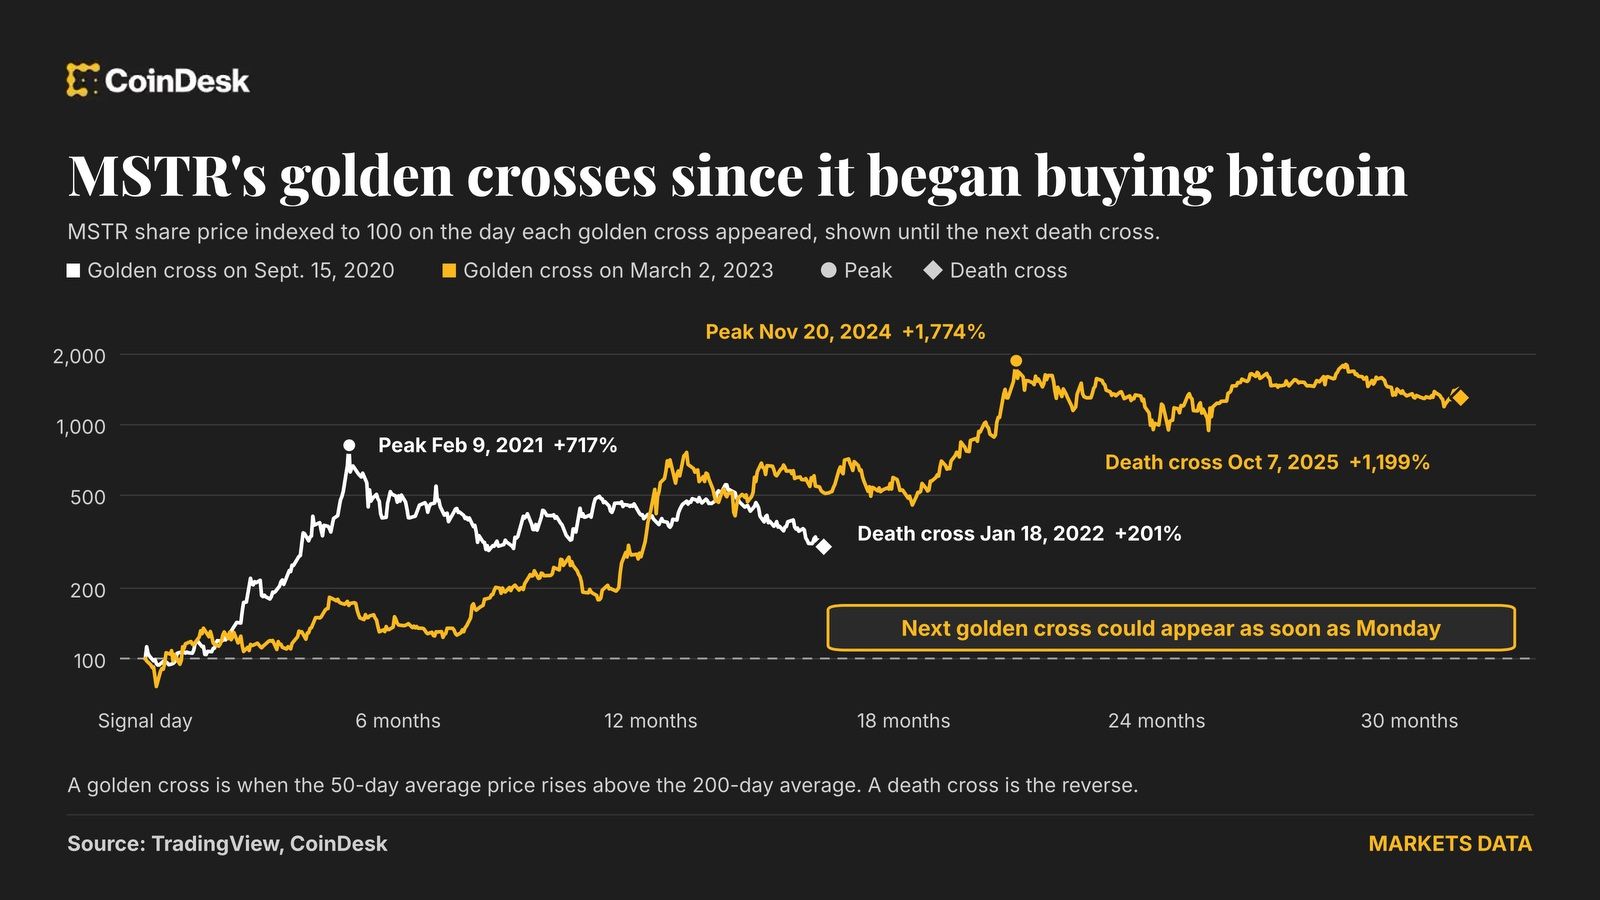
Are you wondering whether a chart pattern like the “golden cross” can reliably predict future price moves? This article explains what the golden cross is, how it is calculated, and why its track record matters for anyone looking to earn passive income from crypto or stocks.
The plain explanation
A golden cross occurs when a short‑term moving average (usually the 50‑day simple moving average) rises above a longer‑term moving average (commonly the 200‑day simple moving average). A moving average smooths price data by averaging the closing price over a set number of days, which helps filter out short‑term noise. When the faster average crosses above the slower one, analysts label the event a golden cross and often interpret it as a bullish signal, suggesting that recent price momentum may continue upward.
The opposite pattern, where the 50‑day average falls below the 200‑day average, is called a “death cross” and is typically seen as bearish. Both patterns are purely technical; they do not consider fundamentals such as earnings, network activity, or regulatory changes.
Why the signal isn’t foolproof
Historical studies show that the golden cross does not guarantee future gains. For example, an analysis of MicroStrategy (ticker MSTR) shares since 1999 found 19 golden crosses. Only 11 of those instances resulted in higher prices three months later, and just 10 led to higher prices after a year. That translates to about a 50 % success rate. The median 12‑month return after a cross was only 3.3 %, and two of the crosses (in 2001 and 2007) were followed by losses of 61 %.
These numbers illustrate two key points: first, the golden cross is a low‑confidence indicator; second, its performance can vary dramatically across assets and market cycles. The pattern’s reliability depends on factors such as market liquidity, overall sentiment, and the presence of other confirming signals.
A real example
In September 2024, Bitcoin’s 50‑day moving average crossed above its 200‑day average, confirming a golden cross on September 8. Following the signal, Bitcoin rose about 5 % to roughly $82,000 and later peaked above $87,000. While the short‑term move was positive, the longer‑term outcome remains uncertain, and the price later experienced volatility. This mirrors the mixed results seen in other assets, reinforcing the need for cautious interpretation.
What it means for you
If you are seeking passive income through crypto mining, staking, or cloud rewards, the golden cross alone should not drive your decisions. A bullish crossover might suggest a favorable environment for price appreciation, which could increase the value of any rewards you earn. However, relying solely on this signal can expose you to unnecessary risk, especially if the market later reverses.
Consider the golden cross as one piece of a broader analysis toolkit. Combine it with fundamentals (e.g., network hash rate, staking yields, project updates) and other technical tools (like volume trends or relative strength index) to form a more balanced view.
What to check / how to judge
- Confirming indicators: Look for rising trading volume, bullish momentum oscillators, or a break above recent resistance levels to strengthen the signal.
- Asset fundamentals: For crypto, examine network health, developer activity, and upcoming protocol upgrades. For stocks, review earnings reports and industry outlook.
- Historical performance: Check how often the golden cross has led to sustained gains for the specific asset you are interested in.
- Risk tolerance: Allocate only a portion of your capital to positions based on technical signals, and set stop‑loss levels to limit downside.
- Time horizon: Golden crosses are typically viewed as medium‑term signals (weeks to months). Align the signal with your earning strategy—whether you plan to hold rewards for months or trade more actively.
FAQ
Is the golden cross a reliable predictor of price increases?
Historically, it has about a 50 % success rate for delivering higher prices after a year, which is only modestly better than random chance. Its reliability varies by asset and market conditions, so it should be used alongside other analysis methods.
Can I use the golden cross for short‑term trading?
The pattern is designed to capture medium‑term trends, not intraday moves. For short‑term trading, you may need faster indicators such as the 20‑day moving average or momentum oscillators.
Should I base my staking or mining decisions on a golden cross?
Staking and mining rewards are primarily determined by network parameters, not price alone. A golden cross may affect the market value of the earned tokens, but it does not change the underlying reward rate. Consider both price outlook and network fundamentals before adjusting your earning strategy.
What’s the difference between a simple moving average and an exponential moving average?
A simple moving average (SMA) gives equal weight to each price in the period, while an exponential moving average (EMA) gives more weight to recent prices, making it more responsive to recent changes. Some traders prefer EMA crossovers for quicker signals, but the classic golden cross uses SMAs.
This article references reporting from coindesk.com.