
Written by Yashu Golastaff writerReviewed by Allen Scottstaff editor
Written by Yashu Golastaff writer
Reviewed by Allen Scottstaff editor
Three signs that XRP price risks falling below $1 in June
MarketsPublishedJun 11, 2026
XRP is forming head-and-shoulders and bear flag setups on its shorter-timeframe chart, both indicating a dip below $1 in the coming days.
XRP (XRP) charts are painting multiple bearish patterns this month with a downside target under $1.
Key takeaways:
- XRP is forming head-and-shoulders and bear flag setups on its shorter-time frame chart.
- An on-chain metric is further signaling weak demand or capitulation sentiment among traders.
Head-and-shoulders setup hints at 10% XRP decline
Since June 5, the XRP price has formed what appears to be a head-and-shoulders (H&S) pattern.
The setup develops when the price forms three peaks atop a common neckline support, where the middle peak, called the “head,” is higher than the other two, the “shoulders.”
An H&S pattern typically resolves when the price breaks decisively below the neckline support, with its downside target measured by subtracting the breakdown level from the structure’s maximum height.
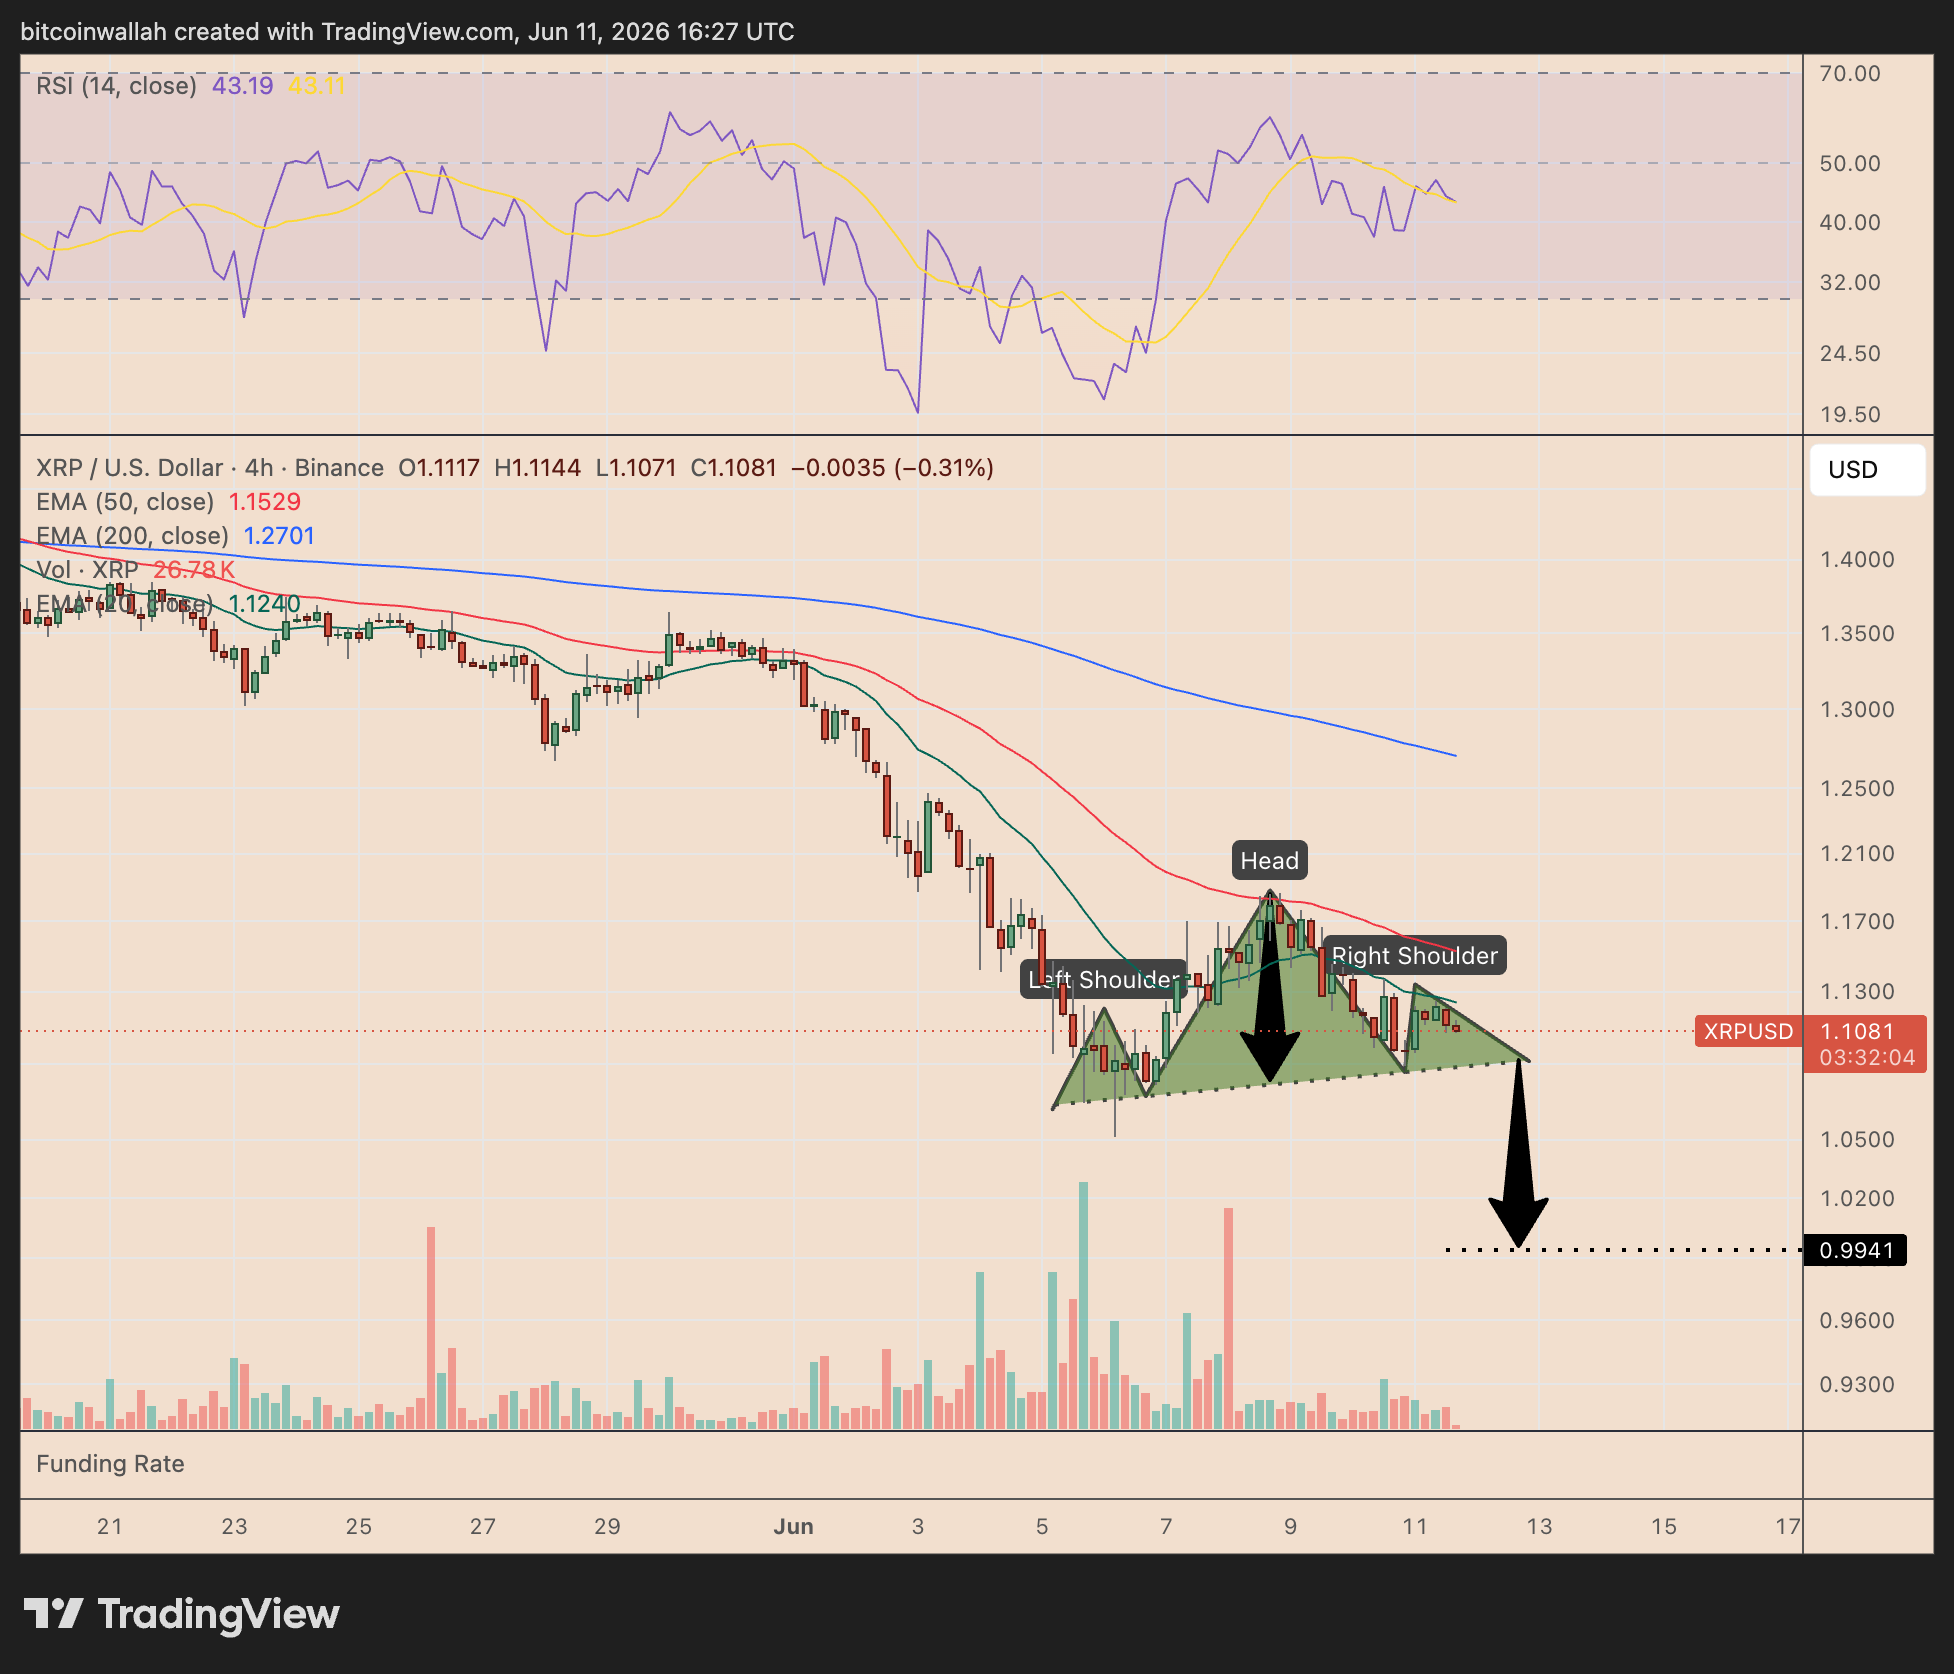
XRP/USD four-hour price chart. Source: TradingView
As of Thursday, XRP was forming the pattern’s right shoulder, eyeing an initial dip toward the neckline near $1.09.
Applying the technical rule, the target for June is around $0.99, down roughly 10%, if the price breaks below the neckline.
Conversely, a clear break above the right shoulder’s peak at around $1.12, a level also aligning with the 20-period exponential moving average (20-period EMA, green) on the four-hour chart, may invalidate the H&S pattern.
In that case, XRP may rally toward the 50-period EMA (red) near $1.15, up 4.5% from the current price levels.
Another bearish setup hints at a lower XRP price target
XRP’s four-hour chart also shows a bear flag, adding weight to the sub-$1 bearish outlook.
A bear flag forms when the price consolidates inside a rising channel after a sharp sell-off. It typically signals a pause before the prior downtrend resumes.
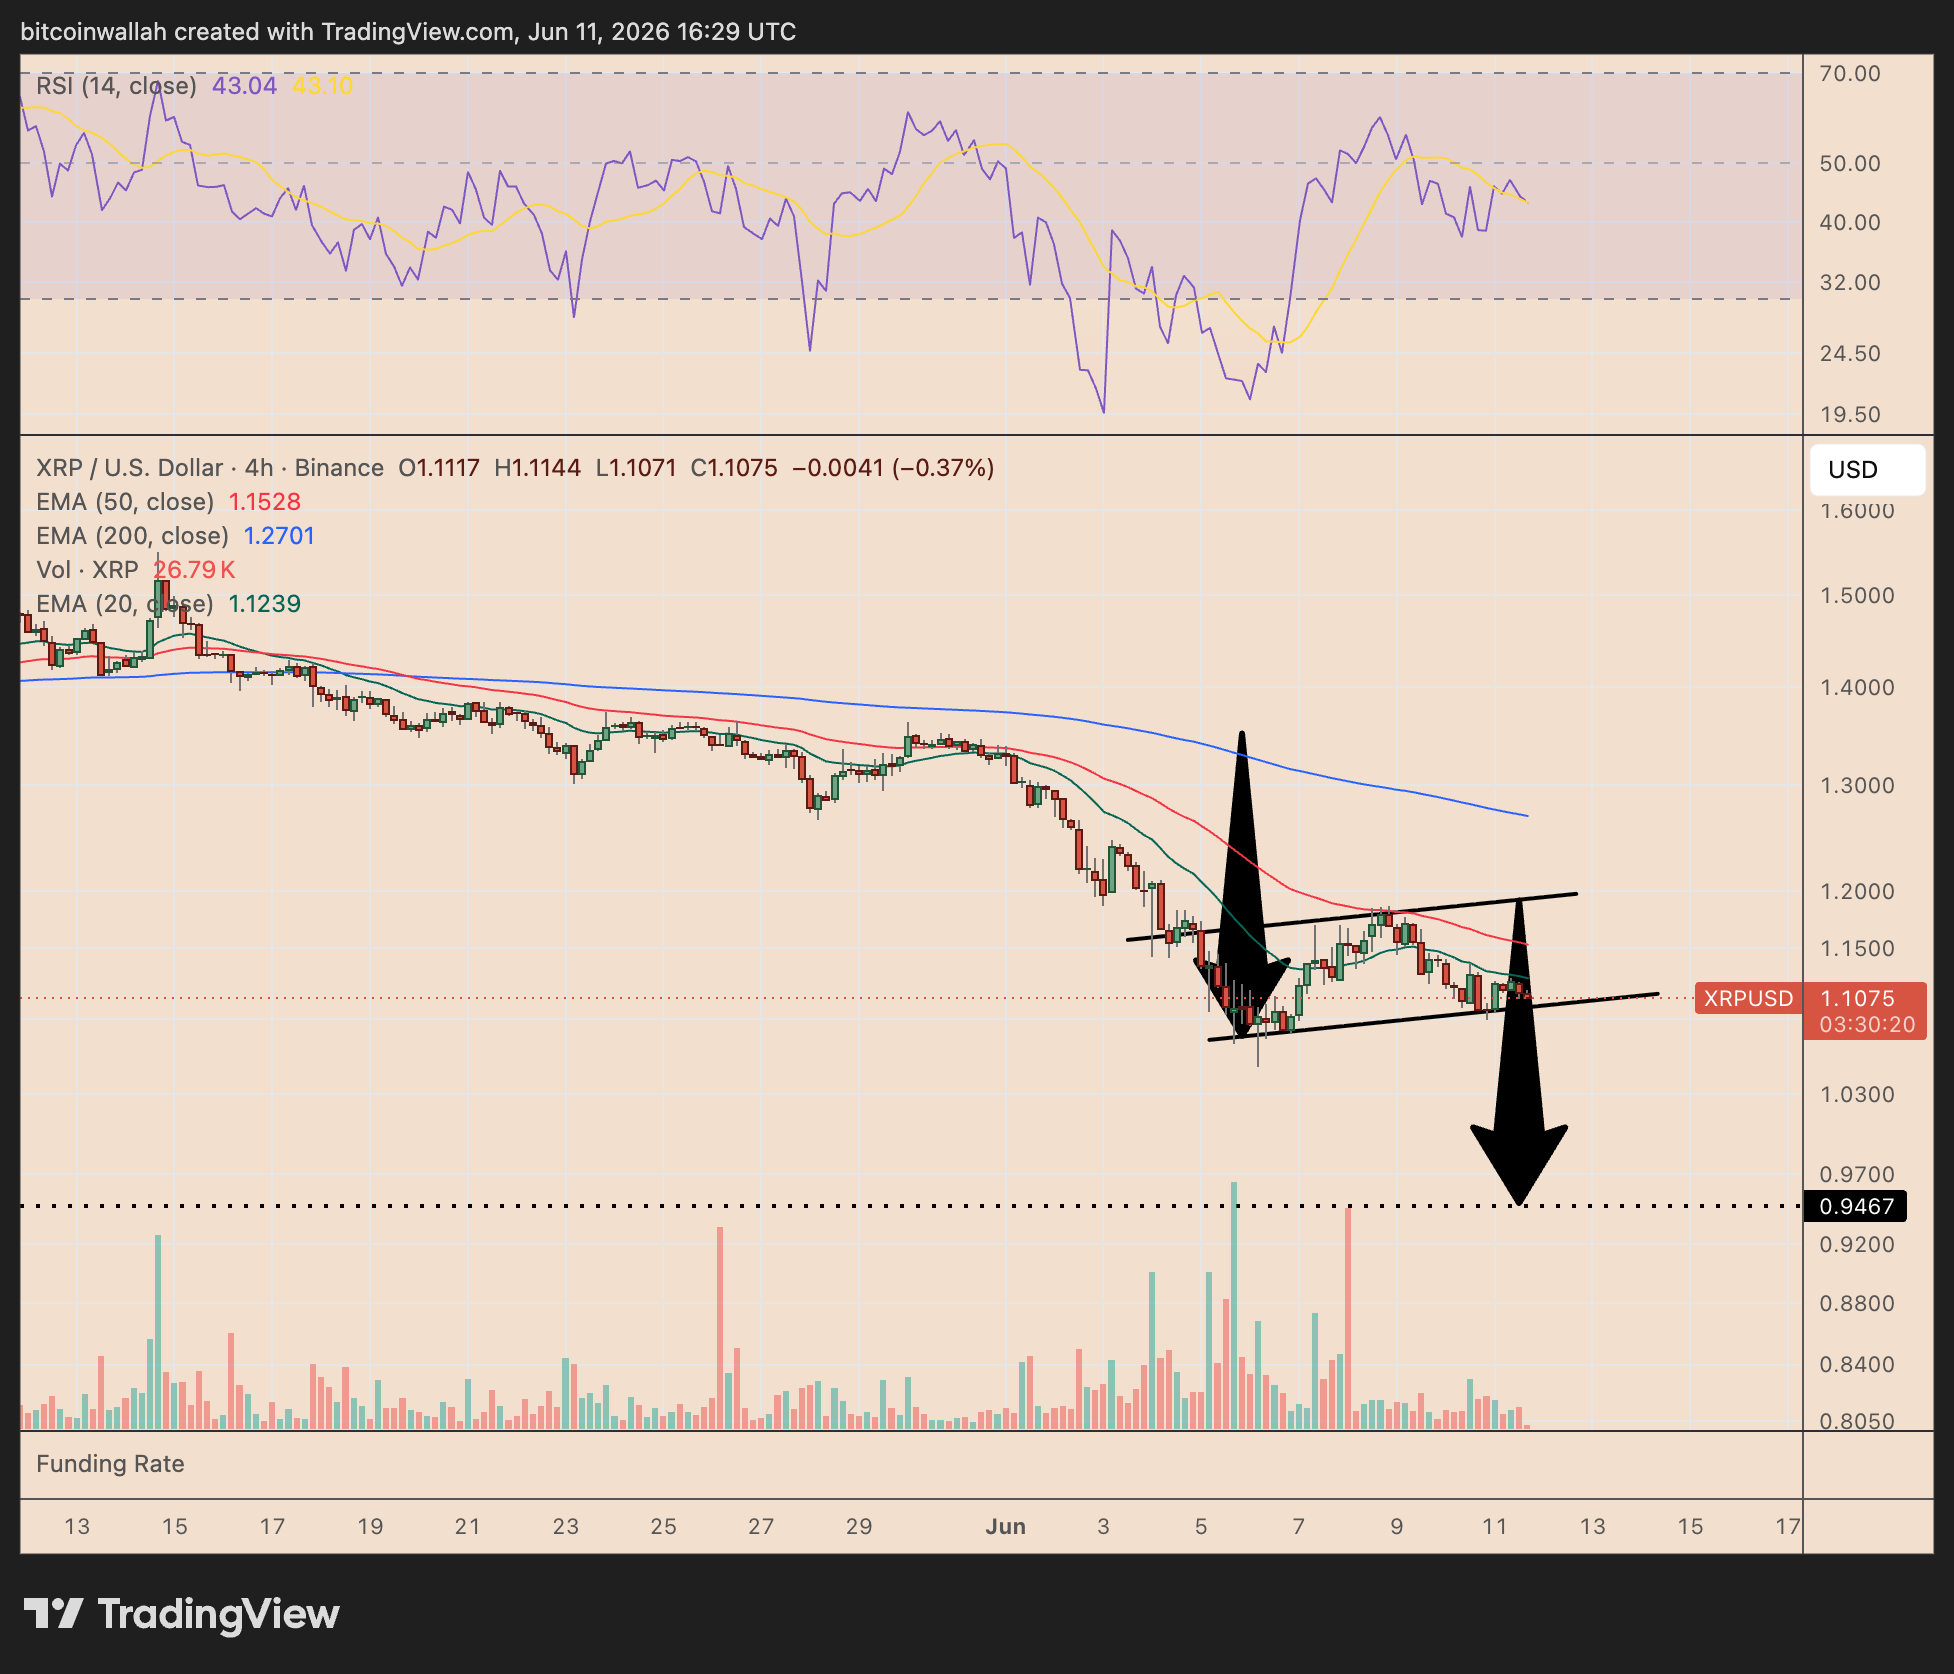
XRP/USD four-hour chart. Source: TradingView
As of Thursday, XRP was testing the flag’s lower trendline near $1.10. A decisive four-hour close below this level could confirm the breakdown.
Applying the technical rule, XRP’s bear flag target sits near $0.94, down roughly 15% from current prices.
The relative strength index (RSI) near 43 supports the bearish view, showing weak momentum below the neutral 50 level.
nevertheless, a rebound above $1.12 would weaken the setup. A stronger move above the 50-period EMA near $1.15 could delay the selloff and send XRP toward the flag’s upper trend line near $1.18–$1.20.
On-chain data points to dip toward $0.96
XRP’s MVRV pricing bands suggest the price still has room to fall toward the lower green zone.
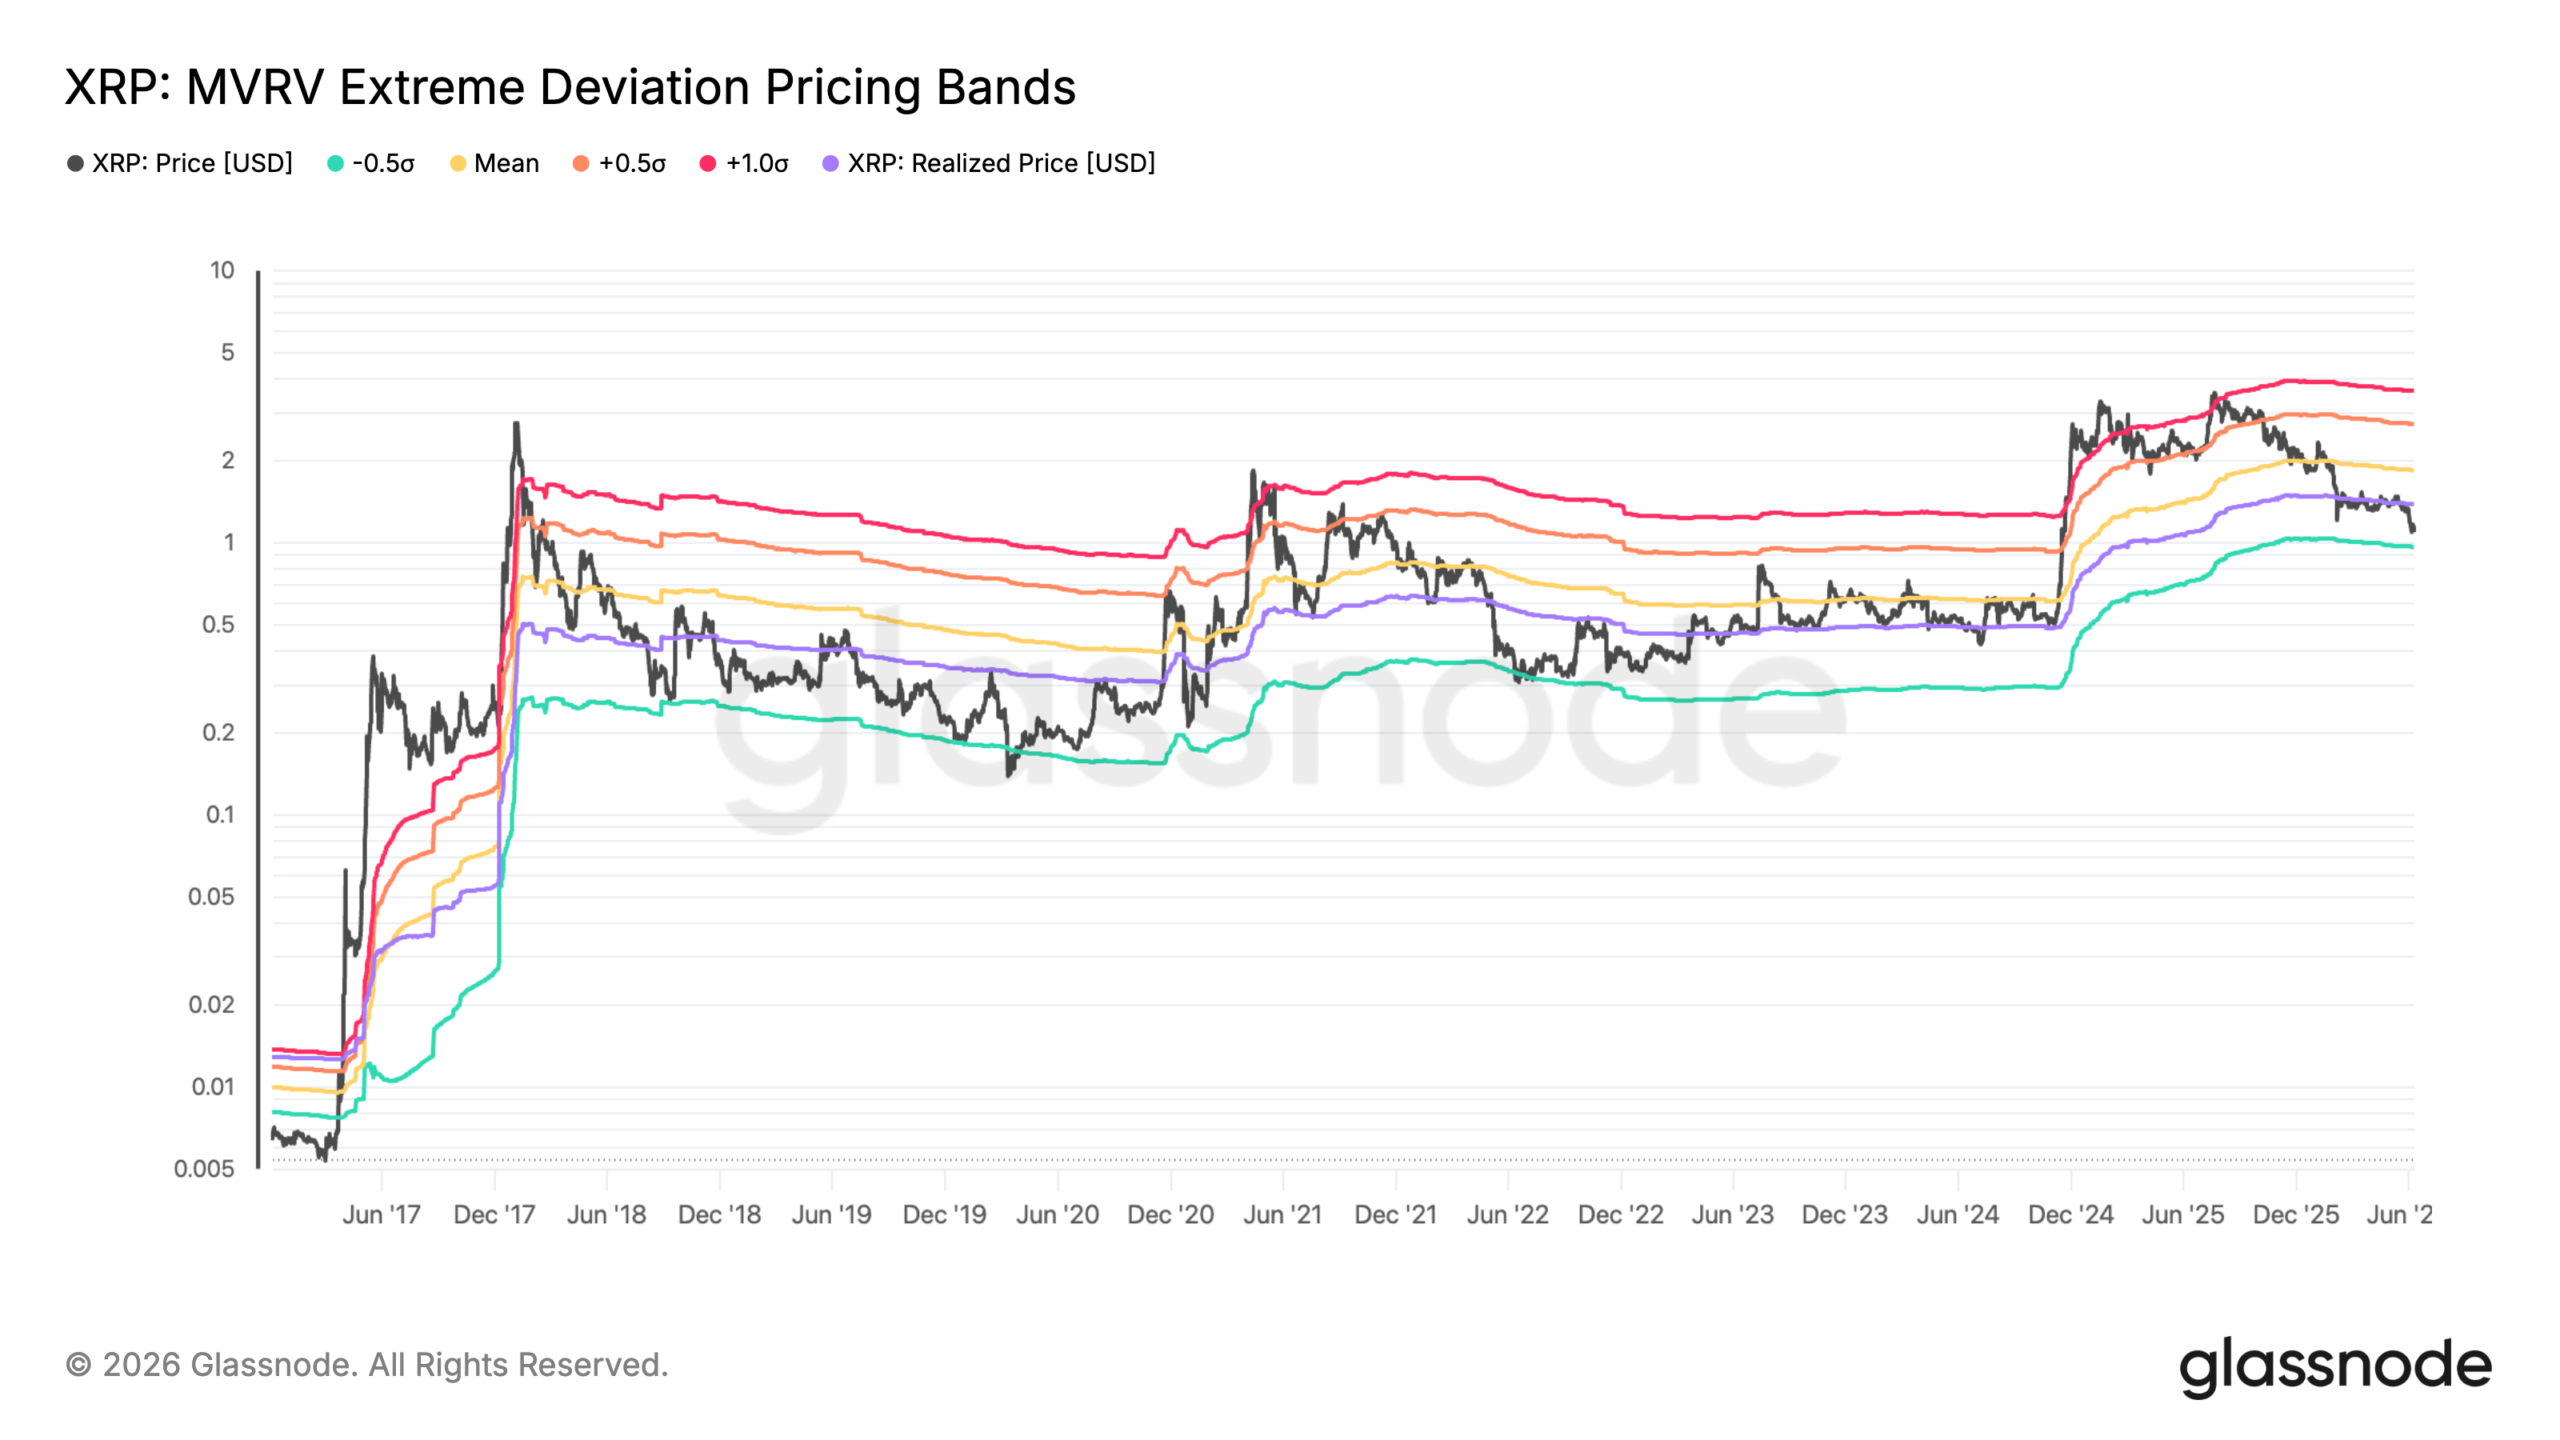
XRP MVRV extreme deviation pricing bands. Source: Glassnode
For new traders, MVRV compares XRP’s market price with the average price at which coins last moved on-chain. In simple terms, it shows whether holders are sitting on large paper profits or losses.
When price trades near the upper bands, the market is usually overheated. When it falls toward the lower bands, it often signals stress, weak demand, or capitulation.
Related: XRP transaction demand falls 91.5% as traders focus on $0.65 support
That lower green band has acted like a bear-market magnet for XRP in previous cycles. It declined toward or below the same zone during major downturns in 2018, 2020 and 2022 before finding stronger support later.
The next major downside target sits near the green lower band near $0.96, about 13% below current prices if history repeats.
This article is produced in accordance with Cointelegraph’s Editorial Policy and is intended for informational purposes only. It does not constitute investment advice or recommendations. All investments and trades carry risk; readers are encouraged to conduct independent research.
- Markets
- Market Analysis
- Tech Analysis
- XRP
- Altcoin Watch
- Altcoins
More on the subject
XRP transaction demand falls 91.5% as traders focus on $0.65 support
21 hours ago
Biraajmaan Tamuly

Arthur Hayes dumps WLD days after Maelstrom’s AI IPO pitch
Jun 8, 2026
Martin Young

Why ZEC fell 40% even after Zcash patched a shielded pool bug
Jun 5, 2026
Dilip Kumar Patairya
XRP transaction demand falls 91.5% as traders focus on $0.65 support
21 hours ago
Biraajmaan Tamuly
Arthur Hayes dumps WLD days after Maelstrom’s AI IPO pitch
Jun 8, 2026
Martin Young
Why ZEC fell 40% even after Zcash patched a shielded pool bug
Jun 5, 2026
Dilip Kumar Patairya