Are you trying to figure out why crypto prices sometimes move even when you don’t see big news? This article explains how open interest, trading volume, and funding rates work together and what those signals mean for anyone looking to earn crypto online.
What open interest, volume, and funding rates actually are
Open interest (OI) is the total number of outstanding contracts—such as futures or options—that have not been settled. Each contract represents a bet on where the price will go, so a higher OI means more money is tied up in those bets. When OI rises, traders are adding new positions; when it falls, they are closing them.
Trading volume measures how many contracts or spot tokens change hands over a given period. Volume shows the level of activity in the market. A spike in volume can indicate that many participants are buying or selling, which often precedes price moves.
Funding rates are periodic payments exchanged between long (betting the price will rise) and short (betting it will fall) positions on perpetual futures contracts. If the rate is positive, longs pay shorts; if it’s negative, shorts pay longs. Funding rates help keep futures prices close to the spot price and reveal the prevailing sentiment among leveraged traders.
How the pieces fit together
When volume climbs while OI drops, it usually means traders are closing existing positions rather than opening new ones. This can lead to a “quiet” market where price moves are driven more by spot buying or selling than by leveraged speculation. Conversely, rising OI with steady or low volume suggests new money is flowing in, often amplifying price swings because leverage magnifies gains and losses.
Funding rates act as a sentiment gauge. Persistent negative rates signal that short positions dominate and are willing to pay longs to keep their bets open, which can pressure the price downward. Positive rates show the opposite, with longs paying shorts to maintain bullish exposure.
Real‑world illustration
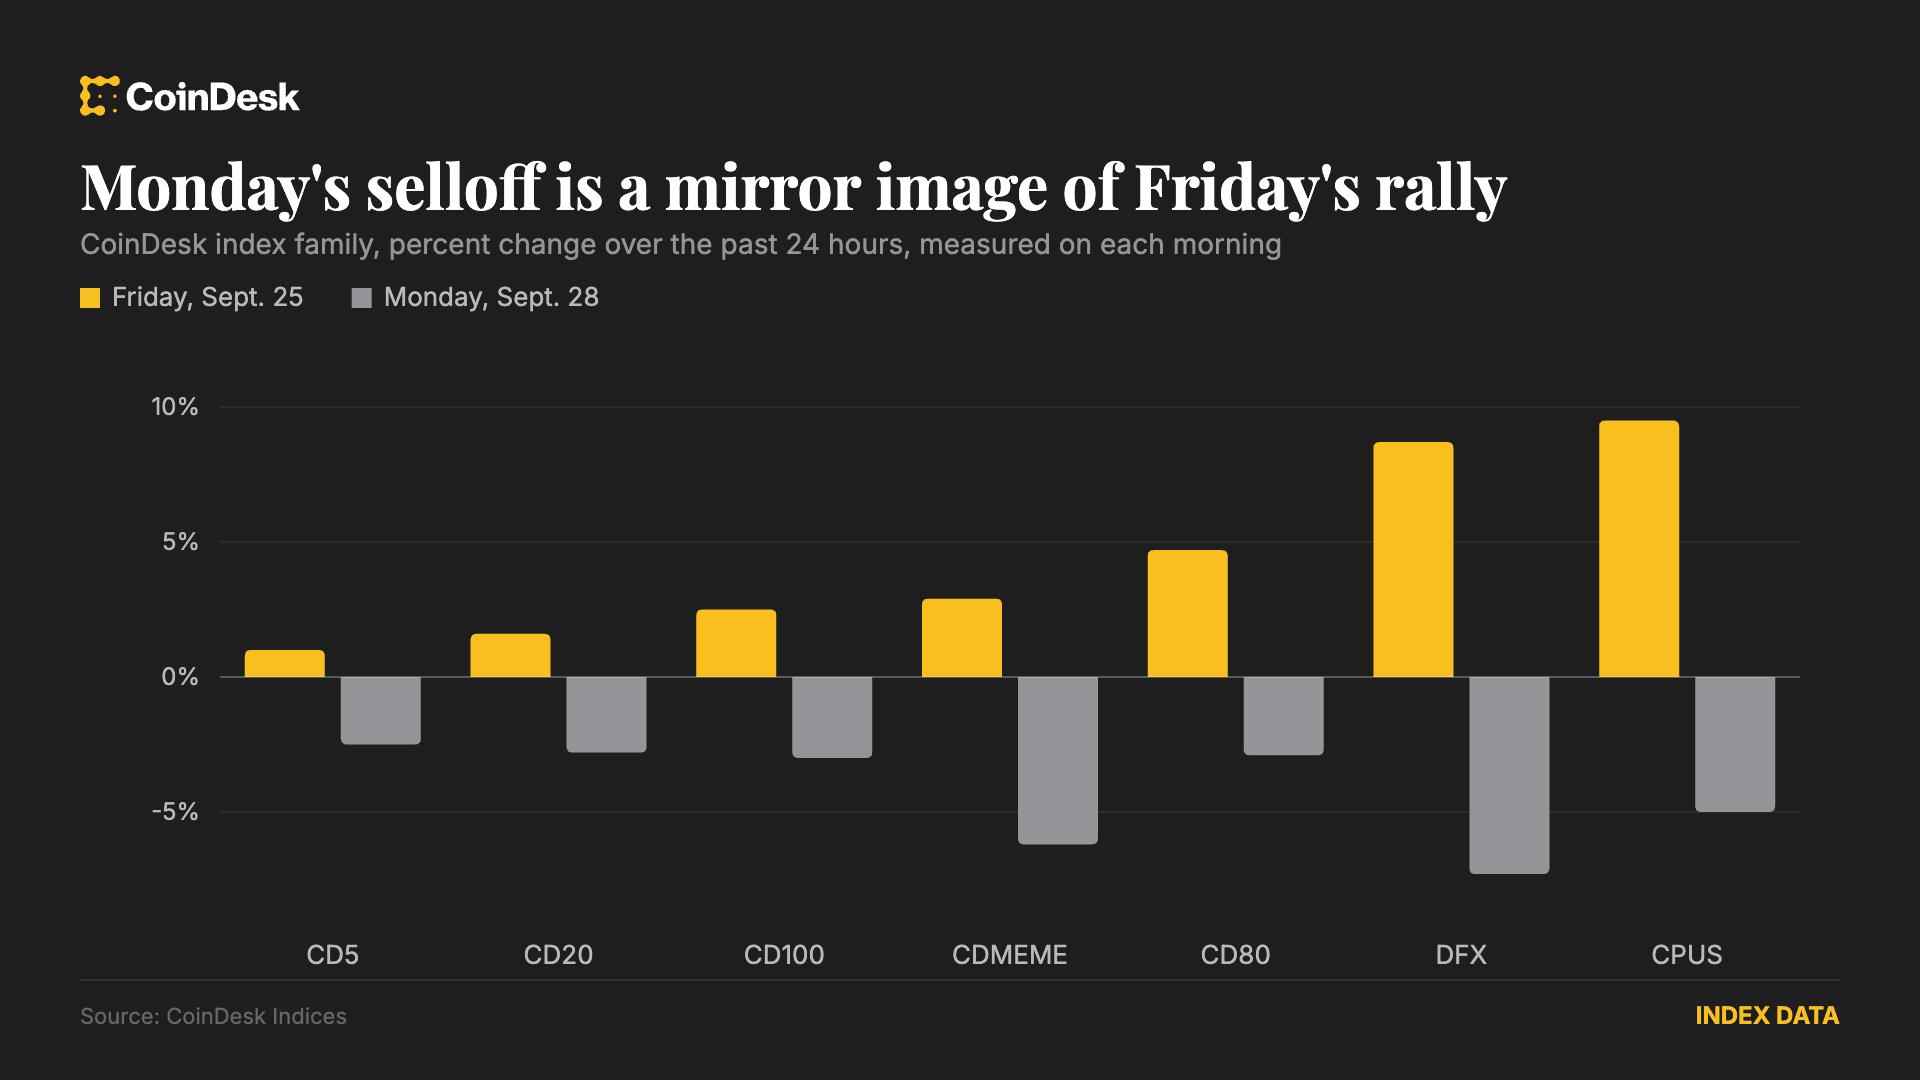
On a Friday in early August 2026, the crypto market saw trading volume jump 70 % to $172 billion over 24 hours, while open interest fell 3 % to $150 billion. The rise in volume paired with the decline in OI indicated that many traders were closing positions rather than starting new ones. The taker long/short ratio was 46.9 % to 53.1 %, giving aggressive sellers a slight edge. Funding rates across major exchanges were negative, meaning short traders were paying longs to stay in the market. These conditions helped push Bitcoin down to $83,000, even though spot buying of Ether and Solana was strong enough to lift their prices.
What this means for you as an online earner
If you earn crypto through mining, staking, or cloud‑reward platforms, understanding these metrics can help you decide when to convert earned tokens into fiat or stablecoins. A falling OI and negative funding rates often precede price dips, so converting some of your earnings before a downturn can protect value. Conversely, a rising OI with positive funding may signal a bullish phase where holding or even adding to your position could be advantageous.
For traders who use leverage, watching funding rates is essential. Paying high funding fees can erode profits quickly, especially in a market where volume is high but OI is shrinking—signs that the price may not move enough to justify the cost of leverage.
What to check before you act
- Open interest trend: Look at the past week’s OI for the asset you care about. A steady decline suggests traders are exiting positions.
- Volume spikes: Compare current 24‑hour volume to the average. A large jump with falling OI usually means position closures, not new bets.
- Funding rate direction: Check the latest funding rate on the exchange you use. Negative rates indicate bearish pressure; positive rates indicate bullish pressure.
- Spot vs. derivatives activity: If spot buying is strong while derivatives OI falls, the price may be supported by real demand rather than speculative leverage.
- Your cost basis: Know the price at which you earned or bought your tokens. Use the above signals to decide whether holding, selling, or hedging makes sense.
FAQ
What’s the difference between open interest and trading volume?
Open interest counts the number of active contracts that haven’t been settled, while trading volume measures how many contracts or spot tokens change hands in a given period. OI shows the size of the market’s “open bets,” whereas volume shows how actively those bets are being traded.
Why do funding rates matter if I’m not using leverage?
Funding rates reflect the overall sentiment of leveraged traders. Even if you don’t trade on margin, extreme positive or negative rates can foreshadow price pressure that may affect the spot market where your earned tokens sit.
Can I use open interest to predict price direction?
Open interest alone isn’t a predictor, but combined with volume and funding rates it provides clues. Rising OI with positive funding often accompanies bullish moves, while falling OI with negative funding can precede declines.
How often should I check these metrics?
For passive earners, a weekly glance is usually enough. Active traders may monitor them daily, especially before making leveraged decisions.
This article references reporting from coindesk.com.